Originally written for ContAzul’s dev blog, in Brazilian Portuguese
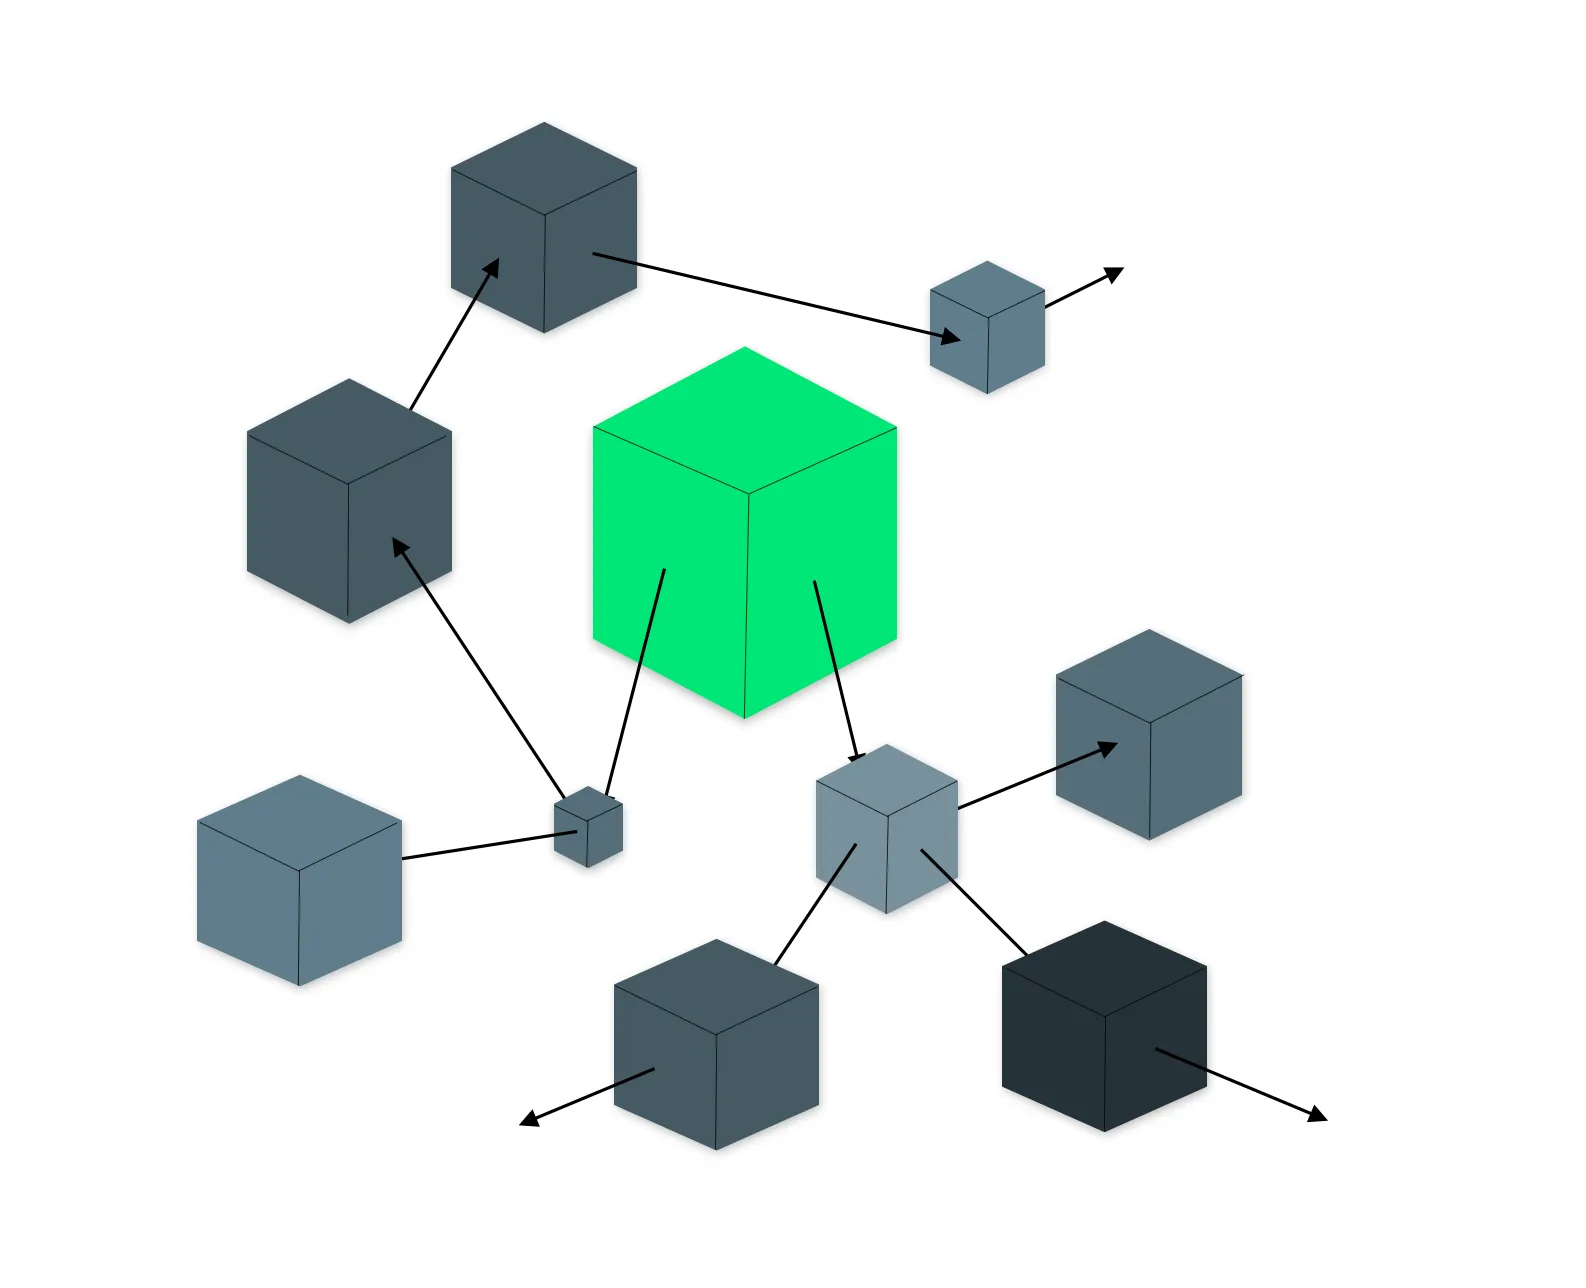
Distributed architectures, such as microservices, offer several benefits. However, they also introduce challenges, such as increased complexity in understanding exactly what is happening in the communication between them. As a result, tools like distributed tracing, service mesh, and circuit breakers have emerged to address these issues.
At ContaAzul, we have a mixed architecture where some functionalities are within a monolithic application, while others, mostly newly rewritten or created, are in a distributed microservices architecture. After creating the first microservices around mid-2015, we began to experience difficulties in correlating the work units performed in each of them.

Additionally, analyses aimed at identifying bottlenecks throughout a request involving more than one service become slow and costly, making it difficult to perform tasks that seek, for example, to increase resilience.
Another factor contributing to increased complexity is the redundancy often applied, resulting in multiple instances of each application. When this happens, we need to identify which instance was responsible for the specific processing to visualize all aspects of the process.

What this monitoring solves
When discussing distributed applications, there are different types of monitoring that can be applied. However, external monitoring, which extracts metrics from external observations, can only provide general views, such as the total request time and the number of times these services were requested.
In the case of distributed tracing, it helps address the following points:
- Identify components with improper behavior: Different components can cause delays, such as database interactions, external API requests, or file processing.
- Observe end-to-end latency: In distributed architectures, latency in one microservice can impact many functions, and tracing helps pinpoint the source of problems and their effects.
- Understand the real relationship between microservices: By visualizing interactions, it’s clearer what dependencies exist, simplifying problem resolution.
Distributed Tracing
Before continuing, there are some terms that need to be discussed:
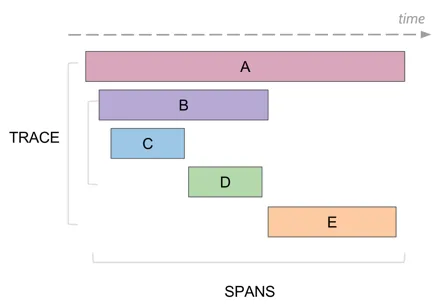
- Trace: Traces represent a complete request. They may or may not include details such as a name.
- Span: A Span is a small processing step within a request. A Trace can have one or more Spans, and these can also contain related information.

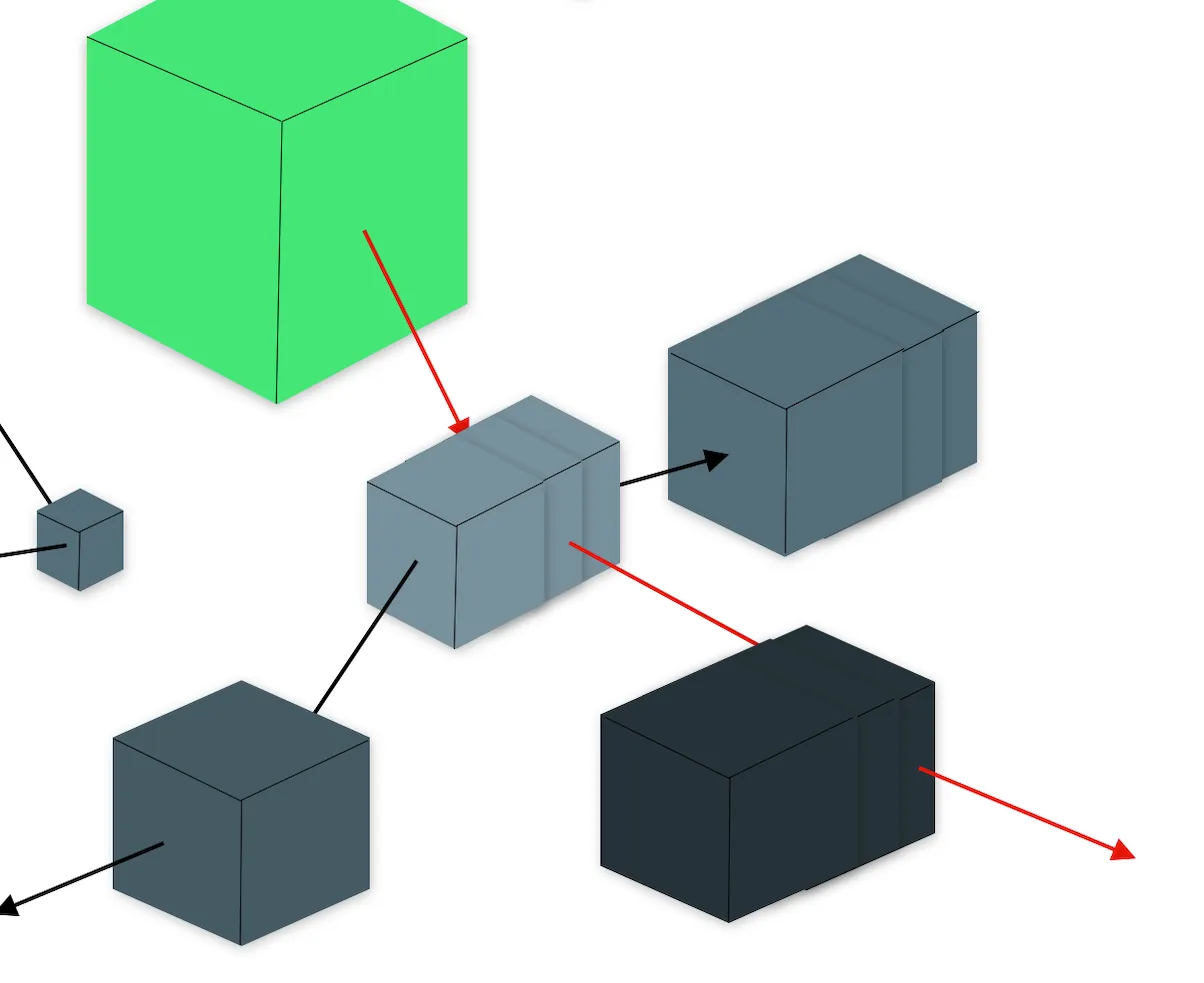
Distributed Tracing tracks the execution of a request throughout its entire lifecycle. This is possible because, when a request is initiated, two identifiers are generated and propagated to all involved applications, allowing information about the processing to be grouped later. One identifier represents the Trace, while the other represents the specific Span. Different applications can initiate different Spans to represent processing steps that need to be reported.
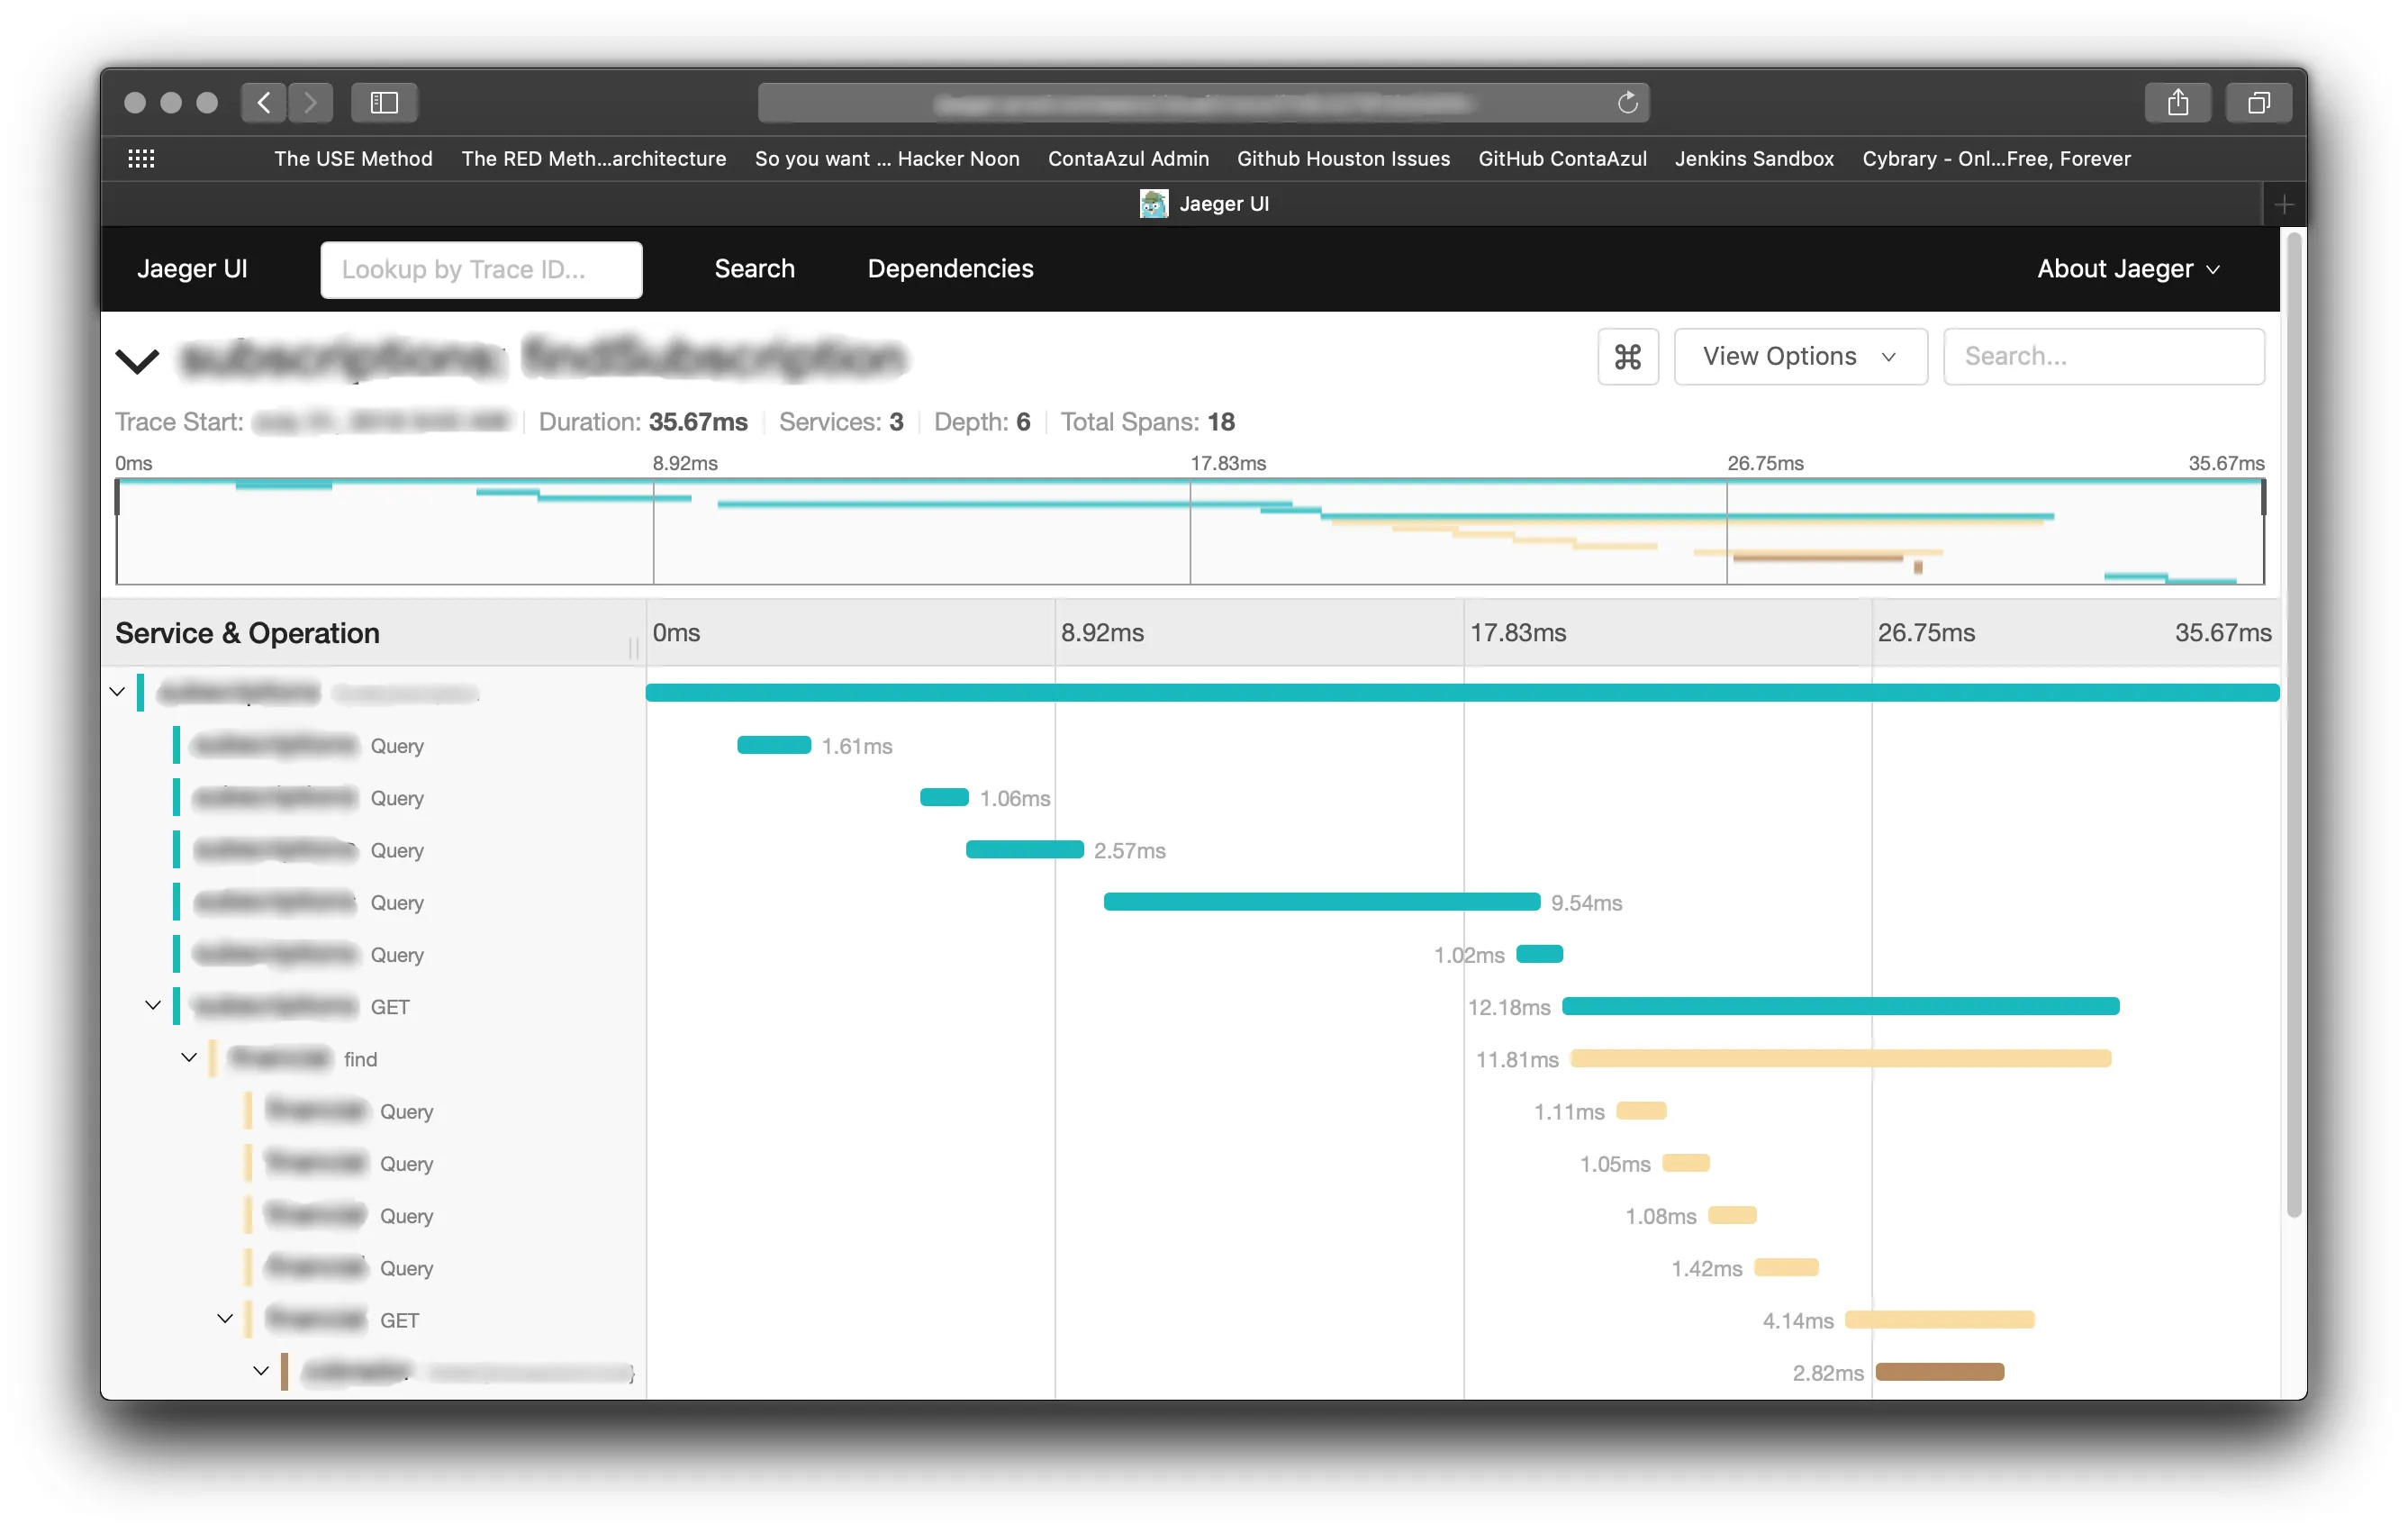
By tracking these requests, information such as the time taken for each step to execute, what this processing represents, specific details (like the query executed on the database), and more can be collected and sent. This enables the benefits previously mentioned.
OpenTracing and Jaeger
At ContaAzul, we use a combination of two projects to monitor our microservices. First, OpenTracing simplifies the instrumentation process by defining an API specification that can be implemented in various programming languages, regardless of the application used to actually store and visualize the collected data. Jaeger, which in our case is the monitoring application, is responsible for ingesting data sent by libraries that implement the OpenTracing API and allowing a clear visualization of Traces and Spans.

Each application has a bit of instrumentation code based on the OpenTracing API specification.
Wrapping up
When making architectural decisions, it’s essential to understand all the impacts they will have on how we interact with applications, whether it’s an interaction with the user or the engineers behind their development. Distributed Tracing, along with other tools, emerges to solve some of the problems introduced by these decisions and allows distributed architectural models to be implemented with greater transparency, reducing the impact on the maintainability of services.